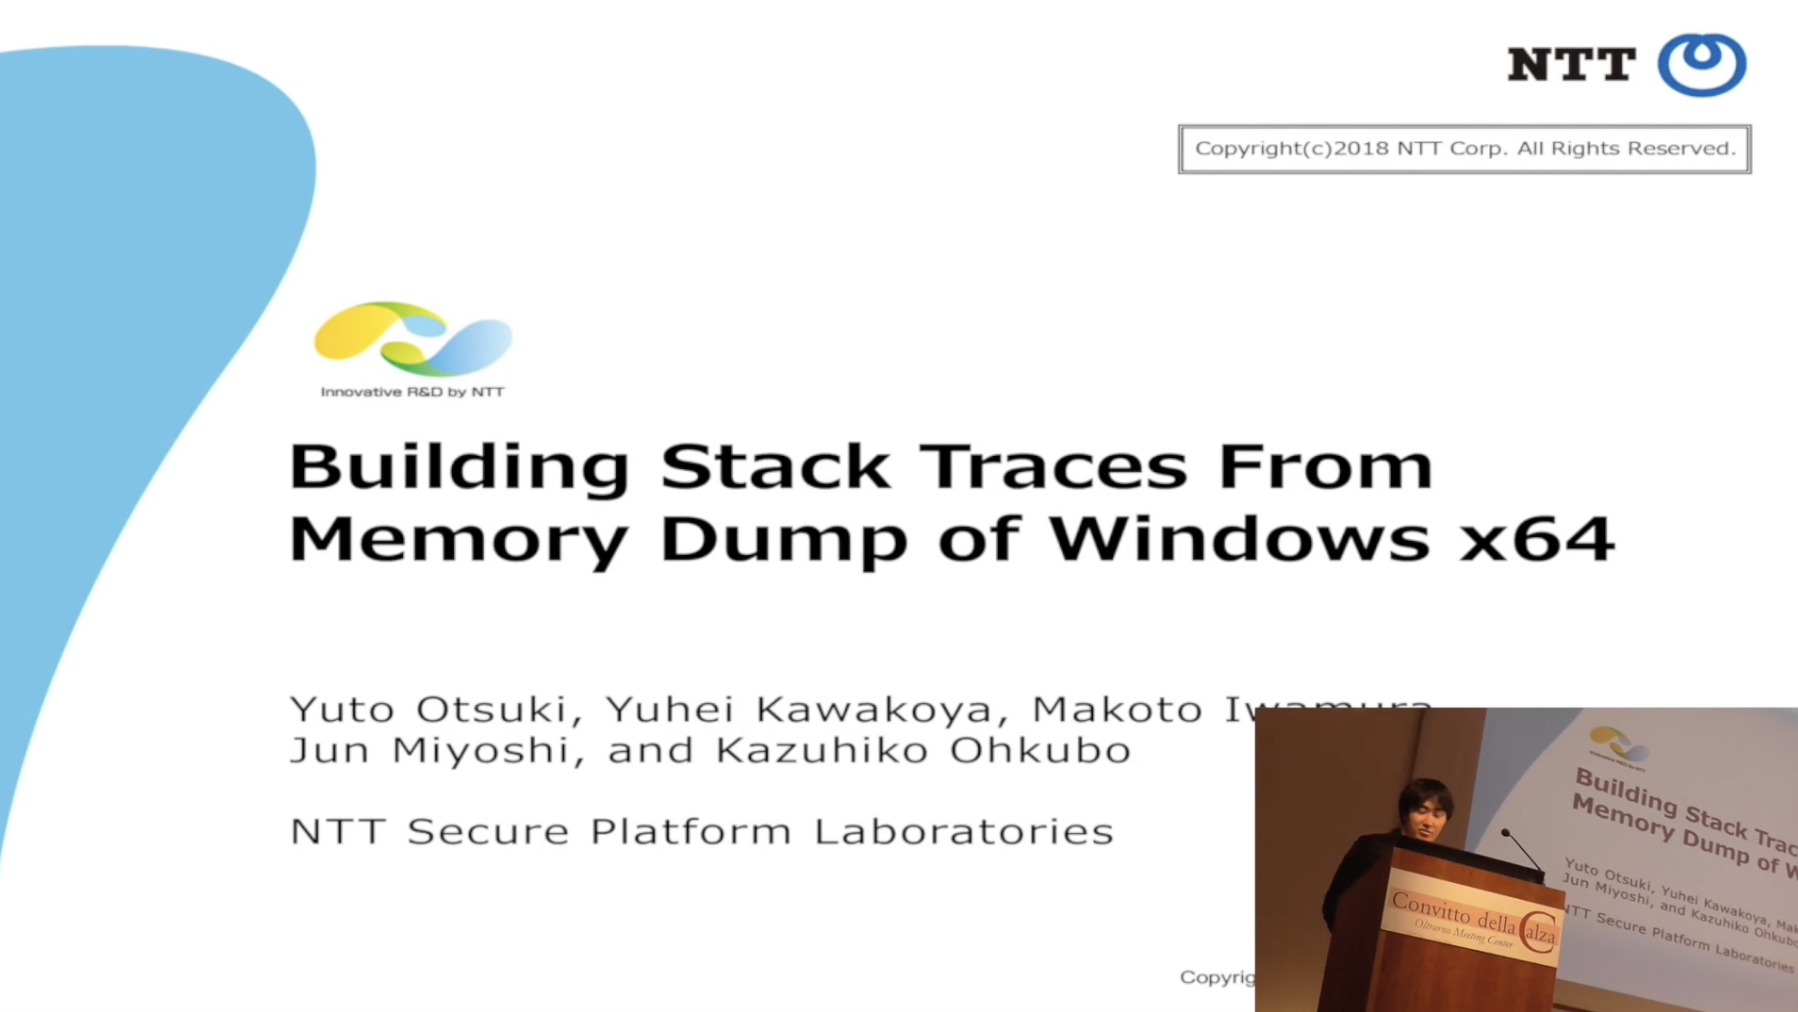
Yuto Otsuki discusses his research at DFRWS EU 2018.
Yuto: Thank you, chairperson. I am Yuto Otsuki, a researcher at NTT Secure Platform Laboratories in Japan.
Today, I’d like to talk about building stack traces from memory dump of Windows x64. Now, as you know, malware is widely used for various cyberattacks. To fight against such attacks, forensic analysis is a conventional approach. And stack traces play an important role in memory forensics, as well as program debugging. Stack traces become a clue to uncover what malware has actually done on the host. However, unfortunately, traditional techniques don’t work for memory dump of Windows x64 environment.
[Nowadays], we propose a new method for building stack traces from such memory dump. I’ll start talking from background.Traditionally, functions used a frame pointer to access their local variables and arguments stored in the stack. Functions firstly push the current value of the frame pointer register to the stack, just like push ebp instructions. And then, the functions update it with the current value of the stack pointer, just like [mov ebp to esp].
As a result, a chain of frame pointers is constructed in the stack. So, we can retrieve [02:17] by walking on the chains. However, in fact, a frame pointer is not dispensable for executing a function. For some reasons, compiler generates functions without using a frame pointer. For example, there are some optimization techniques such as frame pointer omission, FPO [option]. And some calling conventions regulate functions shouldn’t use a frame pointer. X64 Software Conventions for Windows x64 is one example of this.
In such case, a chain of frame pointers is never constructive, in a stack for such functions. Some conventional techniques retrieve return addresses by scanning the stack area. They can be the stack traces without using frame pointer [chaining]. They assume that return addresses satisfy the following conditions. [The] address should point to executable memory area, and the pointed address is right after a call instruction.
Actually, in memory forensics for Windows x64, we actually have no choice but to use scan-based techniques to build the stack traces. Because in Windows x64 environment, functions generally don’t use frame pointers. So, we cannot use traditional techniques. And malware and [these] applications generally don’t have a symbol. That’s why we cannot use WinDbg, Microsoft’s official debugger.
However, the scan-based techniques are potentially inaccurate as far as we experimented. They may mis-detect some other pointers as return addresses, such as just function pointers in the stack and inactive return addresses, which means already returned return addresses.
Additionally, there are some other issues for [practical] use for Windows x64 environment. One of them – where is the actual top of the thread’s stack? OS is allocated space as a stack for a thread, but for the thread, there is no need to use it as a stack. The thread can allocate another space on its own, and then use it as its stack. And [05:42] how should we recognize execution contexts of 32-bit applications on the Windows x64 environment. Windows x64 environment has an emulation layer called WOW64 to execute the 32-bit applications. We cannot retrieve the execution context of such applications directly from the kernel data.
This picture shows the structure of [one] 64 process. They have a WOW64 layer and 32-bit application itself. The 32-bit application is the real target for us investigators. But we have to analyze the layer which managed the execution context of such 32-bit applications.
So, [I’ve] introduced new method which builds stack trace from a memory dump of the Windows x64 environment. There are two main approaches for solving the problem: dmulating stack unwinding and flow-based verifications. And for practical use, our method also includes other functionalities. One of them is to retrieve the last execution context of each thread from the memory dump. And the other is to recognize the context of a 32-bit application.
This is the execution flow of my proposal. In the preparation phase, our method do something like this, reconstructing virtual memory spaces, emulating processes and threads, and so on. And then, our method checks whether the target’s process is x64 process or not. In the main phase, our method of obtaining the user context of the target thread. And then starts building stack traces.
First, I introduce the detail of our method for x64 process. In main phase one, our method gets the [user contexts] of the target thread. Operating system generally stores a thread context into memory when an event occurs. For example, context switches and system call invocations, and interrupts and so on. There are even [09:12] user context as saved … user context is saved into memory. Windows also saves all registers to ETHREAD objects when user-to-kernel mode transition occurs. So then, we can obtain a user context from this this TrapFrame structure.
Next, our method checks whether the metadata for exception handling for the current RIP are available or not. And then, it activates [09:58] from this sub-method … our method has two sub-methods for emulating stack unwinding and for flow-based verifications. Both of them locate the previous return address in the stack, and then, updates the RIP and RSP values. Method repeats executing [these] until RSP reach the bottom of the stack or RIP points to outside the executable region.
Now then, I introduce about the detail of these part. These sub-methods a-2-x emulates stack unwinding in the exceptional handling mechanisms. PE executable files for Windows x64 have metadata for exception handling. The metadata includes information for stack unwinding [11:16]. We can use them for memory forensics to build stack traces.
So, first, our sub-method obtains a base address of the region pointed to by RIP and checks the PE [headers]. Then, sub-method obtains runtime function structure whose range contains RIP from Exception Directory, also known as .pdata section.
Our sub-method unwinds RSP and other registers based on these unwind codes, these unwind codes indicate an operation in the function’s prolog. And sometimes, this unwind information, just like runtime function and unwind info and unwind codes, [12:32] another one. If so, our method repeats from step four until arriving at the last one.
Lastly, our method updates the current RIP after completing all unwinding operations, RSP points here … RSP [dash] … and then, the sub-method pops the previous return addresses, just like [RetAddr], from the stack. By this method, we can get our return address if the metadata is available. But in some case, metadata is not available. In that case, our method activates another sub-method.
This sub-method is the extended version of the conventional scan-based technique. After scanning, the sub-method analyzes control flow to verify the reachability between the detected return addresses.
Firstly, the sub-method scans return address candidates from the current RSP, just like conventional techniques. Then, our sub-method to find execution paths to reach the current RIP from the detected return address. It analyzes control flow inside the function, targeted by each call instruction pointed to by a return address candidate. In this case, pointer two is the actual return addresses, because the current IP pointed inside this function.
Lastly, our method updates RIP and RSP like this. Now then, we can build stack traces regardless metadata is available or not. Next, I introduce our method for WOW64 process. Similar to our method A, method B firstly gets user context of 32-bit application. When a 32-bit application invokes a system call, the emulation layer emulates the system calls. This emulation is very similar to OS’s system call handling. So, the [layer] saves all register to memory like this. So, we can retrieve the context of the 32-bit application from WOW64 context structure.
And to build stack traces, we can basically use traditional techniques walking EBP-chaining, because 32-bit applications conform to the traditional conventions. But custom-tailored feature is required for system call stubs on the WOW64 layer. This is a stack where 32-bit application invoke a system call. The stack for the two RetAddr on [its stub]. First one points to the stub itself, and it will be skipped. And second one points to the caller of the stub. This is actually needed for us. Our method gets it simply.
So far, I have explained the detail of our method. Next, I will explain about variations and experiments for our method. We evaluated that our method accuracy – we implemented our methods as a plugin for the Rekall memory analysis framework and compared it with WinDbg, and we focused on Windows official executable files. Because [its] symbol support is available, WinDbg can get the correct stack traces of such processes. We used a memory dump obtained from this environment, Windows 7 x64 SP1, and memory size is 8GB.
First, we tried to obtain stack traces from the user space of x64 process named notepad. This is the results from WinDbg and our plugin. This result shows all RetAddrs and Child-SPs in the results from WinDbg and our plugin are equivalent, which means that our method could correctly obtain the stack trace of the x64 process. Similarly, we also tried to obtain stack traces from a WOW64 process named calc. And we could get the correct result also. In another experiment, we tried again for notepad. In this time, to imitate a situation of obtaining a stack traces from code regions without metadata, our plugin forcibly activate a sub-method a-2-y. This executes [progress] verification. Our plugin obtained correct results, just like the “with metadata” case, as I mentioned before. Which means our method can obtain the correct result even without unwinding information.
By the way, after unloading symbols in the user space to imitate such situation, WinDbg obtained only the first two entries, like this. This result shows WinDbg strongly depends on symbols, so that it is difficult to use for malware and [20:29] applications, to build stack traces.
Lastly, I introduced about comparison without conventional scan-based technique. We just used the conventional technique to explorer and we found 10 false positives in the result, like this. Red entry is false positives. On the other hand, our plugin obtained the same result as one of symbol-supported WinDbg. So, our method can more precisely identify return addresses than conventional stack-based techniques.
And we also conducted real malware experiment. And we confirmed our method was basically effective. However, we found more complicated and difficult cases. For example, corrupted unwind information and invalid PE headers, malware used. Another case, they used another mechanism for managing user context in user land, such as UMS. And malware sometimes waits for some events without holding threads, such as they tried to hook APIs and then activate their calls.
To solve this case, we need some improvements of our method and another research is required.
And I talk about our limitations … our method. Our sub-method a-2-y cannot narrow the candidates to only in some cases, such as there is indirect calls [via a] register. We should consider a deeper analysis for stack and code. And in this presentation, I introduce our method specially to Windows. But I believe the basic concept of our method can be applied to other platforms. Basically, user context management and exception handling mechanisms are common in other platforms.
Okay, today I introduced the method of emulating stack unwinding to build a stack trace of each thread from only memory dump of Windows x64 environment. And we also proposed our flow-based verification method, which can more precisely identify return addresses than using only conventional scan-based techniques. And our experimental results show the accuracy and practicability of our method.
Okay, that’s all. I thank you very much for kind attention.
[applause]Host: Thank you. Thank you, Yuto.
End of transcript


