Join the forum discussion here.
View the webinar on YouTube here.
Read a full transcript of the webinar here. Quickstart: Your First Imaging Session
First of all, let’s make sure that the drive that we are about to image is in good condition. Click ‘Diagnose’ and select the port on which the drive is located, and then click the ‘Start’ button at the bottom of the screen.
During the Diagnostics process, the following subsystems of the drive will be checked: the circuit board that has the media service, the firmware, and the file system of the drive.
At the end of each subsection of the Diagnostics report there will be a Summary line — either in green colour, in yellow, or in red — summarising the state of the subsystem of the drive. If it is in green colour, it means that the subsystem of the drive is in good condition; if it’s in yellow, there [are] some issues with the subsystem of the drive; if it’s in red, the issues are severe.
Also, at the top of the Diagnostics report there is a box, either in green, yellow or red colour, giving you the summary of the overall state of the drive.
Now that we have made sure that this drive is in good condition, we can proceed with imaging.
Click ‘Image’, select the source drive, then select the target drive, click ‘Continue’ button, and the ‘Start’ button. Now confirm that you are ready to overwrite the data on the target device, and the imaging process has started.
Task-Oriented Interface
While this imaging session is running, let’s return to the homepage. You must have already noticed that TaskForce has a task-oriented workflow: you have ‘Diagnose’, ‘Image’, ‘Hash’, ‘Wipe’, and ‘Other’ buttons. Within the ‘Other’ category you can see additional tasks.
And if you would like to hash a device, click ‘Hash’, and now you can select a device. In this panel, you can see all eighteen of TaskForce’s ports. There are six SATA ports; six SAS ports that can also be used for SATA devices; four USB ports; one IDE; and one Extensions port.
If there are any devices that have an HBA or DCO area enabled on them, an ATA password, or even a short-circuit situation, there will be a notification about it in red colour next to the details of this drive in its port.
Now you can select the drive that you would like to hash, and click the ‘Start’ button to start the process. By returning to the home page, you can track the currently running processes.
How To Image A Source Drive
Now let’s start an imaging session. Once you have clicked ‘Image’, you will see the panel with all devices come up that are connected to TaskForce. However, you are only able to select the devices in the Source mode. This indication here means the port is currently in the Source mode. Remember that the Source switch is located next to this port on the hardware unit.
You will not be able to select a target device here, because this is the ‘Select Source Device’ panel. In the ‘Select Target Devices’ panel you are able to select one or more targets for this imaging session. Up to five targets can be selected per session, and you will not be able to select a Source device, thus protecting all the evidence drives connected to the unit.
Then click ‘Continue.’ Double-check your imaging settings, and click the ‘Start’ button. If your target device is smaller than the source device, you will be prompted to confirm your action. You will also be prompted to confirm that you are ready to overwrite the data on the target device.
Now the imaging session has started. You can return to the homepage to track the status of all the currently running processes.
Home Screen
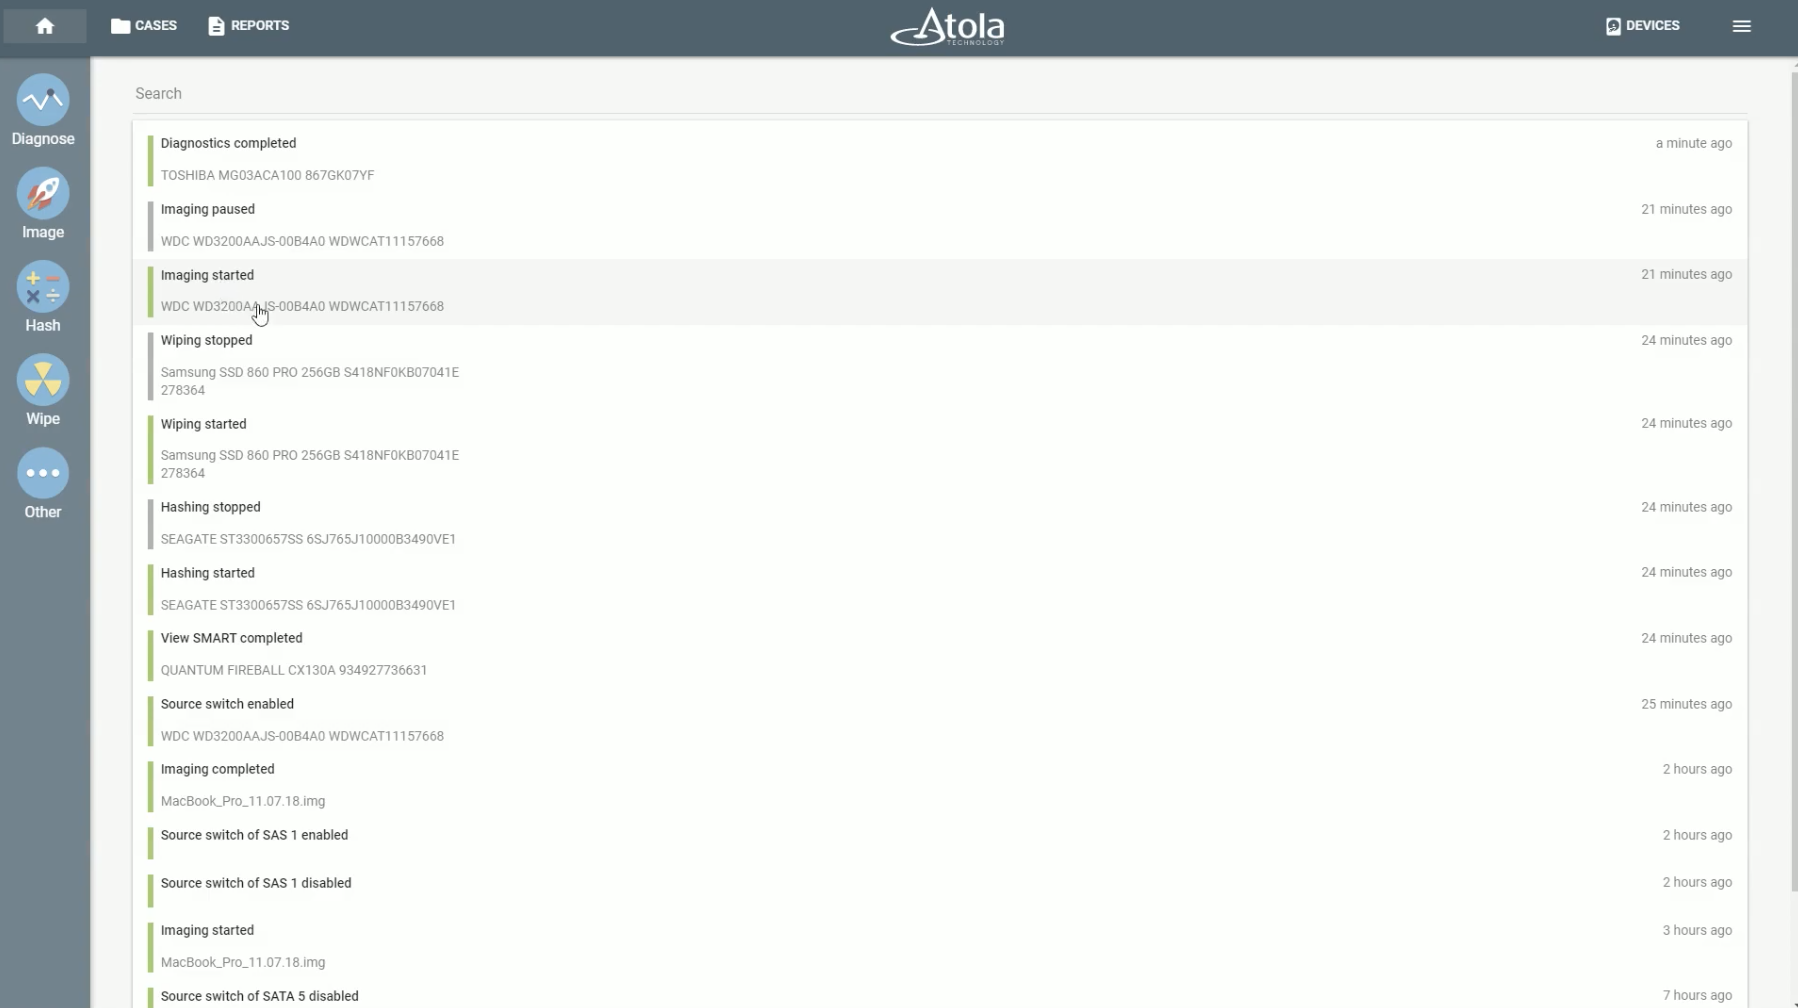
Once you are in the home screen, you see the list of the currently running processes in the upper part of the screen, in the section called ‘Active’. You can click on any of these processes to see what is happening during this session in more detail.
Below the actively running processes, there is a section called ‘Completed’. In it, you can see all of the reports — from the most recent to the oldest — generated by this TaskForce unit. Clicking on any of the lines in this list opens the respective report.
Because TaskForce can be used by multiple users at the same time, who can open its interface in [the] Google Chrome browser of their workstations, you want to be aware of the currently used capacity of the TaskForce. Simply click the logo at the top of the screen to see how much of TaskForce’s capacity is currently being used. TaskForce can achieve up to 15TB per hour speed, or even more; so you can add more operations.
There are now four active processes running, and the overall speed is only 3TB/hour. If you want to look for a specific report among all the completed tasks, use search words such as ‘diagnostics’ to find a certain record. You can also search for a specific drive, or use a combination of search words to get a more relevant search output.
Always Diagnose Before Imaging
Let’s diagnose a drive. Click ‘Diagnose’ and select the port to which the drive is connected. At the top here you see the port, and these are the subsystems of the drive that will be diagnosed during this checkup. Click the ‘Start’ button to launch the process.
So what happens during the diagnostics? First, TaskForce measures and analyses the currents to detect problems with BCB. It also analyses each of the heads, to detect head damage. Then, TaskForce performs an initial media surface reading to detect issues and to estimate the time of imaging. Then there is a set of firmware checks, including smart analysis, HBA and DCO checks; and finally, TaskForce scans for file systems and detects any logical problems with them.
We at Atola technology are strong proponents of running diagnostics on every evidence drive. First of all, if the drive is damaged, diagnostics help you to take an informed decision how exactly to get evidence from this drive using TaskForce. Because you need to make sure that by imaging an evidence drive, you are not causing further damage to it.
Secondly, diagnostics shows you if there is any data on the drive, thus helping you to prioritise the drive among others involving the same case. Last but not least, TaskForce gives you an estimate of how much time it will take you to image this drive.
If we look at the current diagnostics, there are a few issues that the Diagnostics report points to. First, one of the smart table parameters indicates issues. The drive is not in perfect condition, but TaskForce can still image data from it. Secondly, there are many small-sized partitions of an unknown type on this drive, and they only take up 4% of the drive’s space, while 95% of the drive is not associated with any partition. It is very unusual.
Now let’s have a look at a diagnostics report of a drive in good condition. Let’s open any green Diagnostics report.
First of all, this report shows that we need 2 hours and 11 minutes to image this device. Also, the analysis of the file system shows us that there are two partitions on this drive, and they take all of its space.
Imaging To Various Target Types
Let’s image a drive to a few different targets. Click ‘Image’ and select the source drive. In ‘Select target devices’ panel, select up to five target devices you will be imaging to. To image to a file, select the ‘File’ option; and if you want the image file to be written to another drive, click ‘Add storage’ button and select the drive on which the image file will be stored. If this drive is not in exFAT format, you will be prompted to format it accordingly. The formatting will take a few seconds.
Now click the plus icon to create an image file on this drive, and fill in the file information. If it is an e01 file, you can choose if you want it to be a compressed e01. The drive that now contains this file is in storage mode, and it can no longer serve as a target drive: it’s not available for selection.
If you want to have another image on the target, select another device in the target mode. If you want to store an image on your local server as well, select the ‘File’ option again, and this time, create a file inside a folder on the server. You can adjust the format of the file accordingly. Click ‘Continue’ button; double-check the imaging settings, and that all the targets are assigned correctly; click ‘Start’; and confirm that you want the data on the target drive to be overwritten.
Diving Into Imaging Settings
Let’s do logical imaging. Click ‘Image’ and select the source drive. You can see that 50% of data from this drive was imaged during the previous imaging session. Now you want to start a new one.
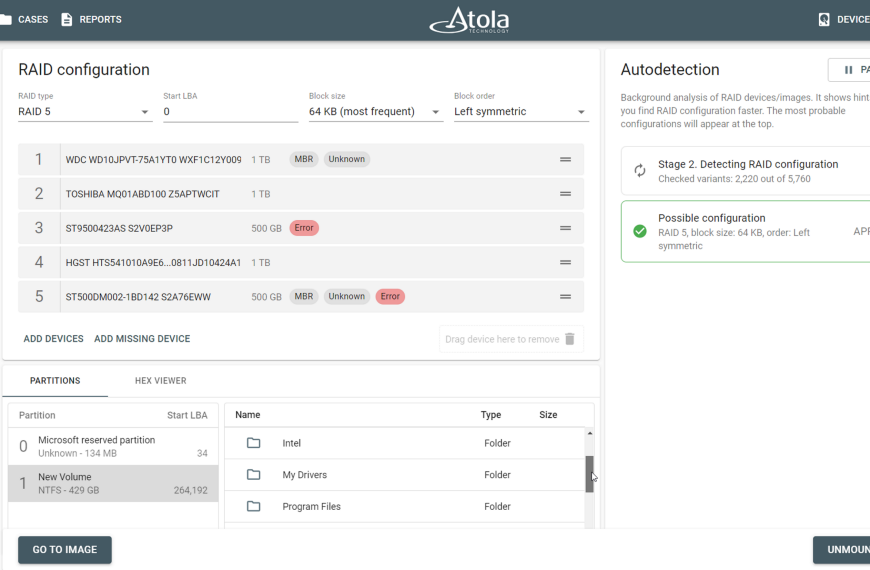
Select a target device and click ‘Continue.’ To do logical imaging, you will need to adjust the default settings. Click ‘Change’ button at the top of the page. You are now in the the ‘Passes’ tab of the settings. The multi-pass imaging system is what allows TaskForce to handle damaged media. The settings within the passes are adjustable, but the settings are based on our decades-long experience in data recovery, and work in 95% of all cases.
At the bottom right corner of the Settings page, you can select a preset that can be created for a specific type of case and shared with your colleagues.
In the Hashes tab you can adjust hashing options, including the type of hash and how it is calculated within an imaging session: before, during, or after one. In the Miscellaneous tab you can adjust different settings, like reading SMART table information before and after imaging; powering down the source devices when finished; limiting the target drive size to the evidence drive size; and saving imaging report in the target folder.
With the default imaging settings, all sectors of an evidence drive are imaged. To image only sectors that contain data, click ‘All sectors’ in the Passes tab and change it to ‘Sectors with data.’ Then you can look at the partitions found on the source drive. Click ‘Save.’
Please note that calculating hash during imaging is impossible if you do selective imaging. This setting is changed in the Hashes tab automatically.
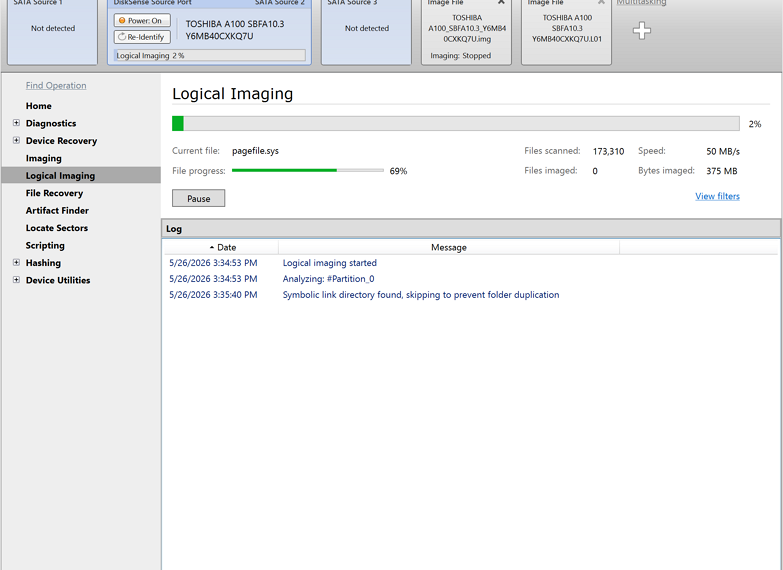
Now click ‘Start’ to proceed with imaging. The sectors that belong to partitions and contain data are marked blue in the image map bar. They gradually change their colour to green as they are imaged.
Below the iaging map bar, there is a black and green read speed graph, which shows the time at which TaskForce is reading data from the source drive. Lower yet, there is the imaging log that records the key events of this imaging session, including the start of the imaging and the time when each of the partitions started to be imaged.
Between the imaging map bar and the read speed graph there are different indices that help you understand the progress of the session. The percentage indicates the proportion of the imaged data to the total planned amount of data. You can also see the current speed of imaging, and the estimated time left. This session should be completed in under two minutes.
In the bottom right corner you can click ‘View settings’ button to see the settings of the current imaging session.
Imaging Damaged Drives
To image a damaged drive, click ‘Image’ and select your source and target devices. Let’s have a thorough look at the imaging settings to understand how they help TaskForce to handle the damaged media.
In the Passes tab of the imaging settings, you can see the five passes. There are a few key settings each pass has. The jump on error defines the number of sectors the imaging engine will skip on this pass, upon encountering an error. The time out setting defines the amount of time TaskForce will spend trying to read the data within a sector.
The max read block size setting: the bigger it is, the faster the data is read; but smaller blocks allow a more thorough data retrieval process. To adjust the settings, click on a pass. Here you can see the reverse direction setting. It allows reading sectors of the drive in the opposite direction of this pass. [Disabling the] read look ahead option disables the drive from cacheing the sectors beyond those addressed by the imager.
You can adjust the pattern with which the unreadable sectors will be filled on the target device. The passes with adjusted settings are marked yellow. In the Hashes tab, you can adjust how hash should be calculated during this imaging session, and select the type of hash to be used.
In the Miscellaneous tab, you can select a few different options. ‘Read SMART table information before and after imaging’ helps keep track of the drive’s health status. ‘Power down source and target devices’ helps when, for example, you deal with an unstable source drive. ‘Limit target disk drive to source drive using HPA for SATA devices’; and finally ‘Save report in the target file folder’, which is available only for image targets. By clicking back, the adjusted settings are saved.
You can double-check that all the settings are correct, and then go to the presets. There are currently two presets: default and Vitaly. Let’s create a new one, so that later you can easily use the same settings when dealing with a similar case. The presets can be exported and sent to your colleagues so that they import and use them on their TaskForce units.
Now let’s start the imaging session.
And here comes a bad sector. It is marked red, and TaskForce performs a jump by one million sectors. About the read speed graph, you can see the total number of errors encountered on this drive, and it is constantly growing. The same is recorded in the log.
Now let me explain exactly how the multipass imaging system works and retrieves data from the bad drives.
This is the space of the drive that you are imaging, and TaskForce reads data sequentially from the first sector to the last one. Once TaskForce encounters a block that contains a bad sector, it performs an automatic jump by one million sectors, as defined by the settings of the first imaging pass. Then it continues to image the sectors after the skipped area.
So why do we choose to perform the jump after an error? Because based on our experience in data recovery, areas often come in groups, and you will encounter more errors in the subsequent sectors in many cases. That’s why we choose to skip the potentially bad area and continue imaging the good areas of the drive first, for a more efficient imaging process and more gentle treatment of the drive.
Once the first pass is completed, TaskForce returns to the problematic area of the drive and spends a little more time, as defined in the time settings, to read data in this area. Should it encounter another bad sector in this area, it will make a smaller jump of 20,000 sectors.
On each subsequent pass, TaskForce will be allocating more time to read a bad sector and making smaller jumps, to narrow down the bad areas of the drive and read data from the good ones.
At the end of the last pass, you will end up with 90% or more of the data from the drive. Very often it’s 95%, sometimes 99%. With reverse imaging option selected on the second pass, TaskForce may be able to narrow down the bad area of the drive faster, as it will read all the good sectors in the opposite direction, up until it hits a bad sector.
Coming back to our imaging of a bad drive, you can see that there are already 51 bad sectors encountered during this session, and down under the read speed graph the log section has recorded all the jumps it made.
In TaskForce you can pause and resume an imaging session. A report about this session will automatically be created by the system.
To resume the session, click ‘Image’, select the same source drive. The paused session will be listed, and by clicking the ‘Resume’ button next to the session, you can restart it. TaskForce will continue to image only the remaining sectors that it hasn’t imaged before the pause.
Back in the home screen, you can look up all the reports related to this session. The imaging started report enlists all the initial settings, the times, and other details. The imaging paused report gives you the log with all the errors and jumps performed. The imaging resumed report again shows you the settings and the timestamps.
Imaging Report In Detail
Let’s start another imaging session. Click ‘Image’ and select the source. Here you can see the imaging sessions that have been done with this device as a source. The imaging sessions ran to different target drives and had different sections of the drive imaged. Both sessions can be resumed as long as both the source and target devices are connected to TaskForce.
Now click ‘Start new’ button and select another set of targets. This time we will select two targets: one of them is a drive, another one is a file. Click the ‘plus’ icon to create a new file. Here you can choose whether the file should be a compressed e01.
Once you have the target selected, click ‘Continue.’ To adjust the imaging settings, click ‘Change.’ What looks different during this session is that there is only one pass, and it is because, with a compressed e01 file, imaging can only be performed in one pass.
Let’s image only a part of this source drive. Click on the pass settings and change the range to be imaged to five million sectors. Then click ‘Save.’
In the Hashes tab, we select the hashing type and how it should be hashed. In the Miscellaneous tab, we select ‘Read SMART table information before the start and after the end of imaging.’
Before starting the session, to save the settings, click ‘Back.’ Please note that the settings will be saved in the currently selected preset. If you want the current preset to remain unchanged, switch to Default preset or create a new custom preset before you click ‘Back’, and save the adjusted settings.
In the top right corner, you can see that there are two targets in this session. You can look up the details of the target by clicking this element. It will take a few more seconds for the imaging session to be completed, and the post hashing will calculate hashes for both targets.
Once the post hashing is completed, you can see the automatically generated ‘Imaging completed’ report, which gives you a detailed record of the session including the imager; the source drives; the target drives; the passes; and their settings.
You cannot see the specific settings here, but there is a separate ‘Imaging started’ report that is also automatically generated that enlists all these details. We will look at it later.
Here you can also see the hash values of the source and both targets.
Lower in the report, you can see the SMART table before imaging that provides the stats for the drive’s operation as recorded by the drive’s own system; and another one recorded after imaging. Comparing these two tables helps keep track of changes in the drive’s health status. All the differences between the indices in these two tables would be highlighted yellow. You do not see any yellow highlighted in these tables, which means that the drive is in good condition.
And finally, the imaging log at the bottom of the report provides the record of all key events of this imaging session, including the time that the session started and was completed; when post hashing started and was completed.
Click ‘Go to case’ button to view all the reports related to this drive. Open ‘Imaging started’ report to view the settings selected for this session.
Both of these reports can also be found in the home screen: open them by clicking the respective report. You can switch between reports with the help of the arrows at the bottom of the screen.
Understanding Case Reports
In the home screen, you can see all the reports as generated, from the most recent one to the earliest one. Every action that happened to the connected drives, or the unit itself, is automatically recorded, including the physical turning on or off of the ‘Source’ switch on the hardware unit.
When you open any drive-related report, at the top you will see the header. It contains the most important details of the drive, the port, and the TaskForce unit. Below there is always the time the report was generated [and] TaskForce details including the IP address, the serial number, the software and firmware version.
The header indicates that the header was connected to a certain port and write protection was enabled or disabled during this session. And there are drive details as well, including the model and the serial number, and the capacity of the device.
If you switch between different reports within this case, you will see that the header remains identical, lest for the time of report creation, and if case number and other details are added at some point, they will be displayed in the subsequently generated reports.
To ensure that all of your reports have case details filled out consistently, go to the Service menu by clicking the Menu icon at the bottom right corner of the screen, and open the Settings category. In the Cases subcategory, enable the ‘Set case details before task starts’ feature, which will prompt operators to fill out case details before any operation can be performed on a drive.
How To Print Or Export Case Reports
Click the ‘Reports’ button in the top panel to view all the reports generated by this TaskForce unit. You can select all the reports and have them printed, but given how many reports there may be, usually you’ll want to search for specific reports.
For example, you can search for all reports related to Toshiba devices. And then you can have them printed out.
You can choose to have the logs; non-device reports; and information about the unit’s components to be excluded from this printing job. By clicking ‘Generate’ button, you generate the list of all selected reports.
Scroll down to ‘Preview’, and here you can notice some reports whose headers look somewhat different. These reports were imported from Atola Insight Forensic, another device produced by Atola, and these reports were imported to the TaskForce database.
Click the ‘Print’ button and choose if you want to generate a PDF file with all the reports, or have them sent to a printer.
Sharing A Case With Another User Of TaskForce
Click the ‘Cases’ button and find the case which you would like to export from the database. Select the case, click the ‘Export’ button at the bottom of the page. The case has been downloaded.
Now let’s import it back to the TaskForce’s database. If the case number and the case coincide, the previously existing case will simply merge with the imported one.
Wiping Target Drives
Click ‘Wipe’ in the Task panel. None of the source devices are available for selection, to enable protection of the data on all evidence drives connected to the system. Only the drives in Target mode can be selected for this action.
Select the drive you want to wipe, and in the wiping settings you can set the range you want to wipe, and the wiping method. The first one is linear wiping, where you enter the pattern with which you want to fill the sectors in either hex or ASCII mode. With this wiping method, the drive space is filled with zeroes, with the LPA number of the corresponding sector at the beginning of each sector.
The NIST method implies that the drive’s space will be filled with binary zeroes and verified afterwards. For the DoD method, which performs a three-pass linear overwriting of this drive space with different patterns, you can enter a specific pattern you would like to be used on the last pass. ‘Random’ is the method that overwrites all the bytes in the sectors with random values.
Select the method you want, click the ‘Start’ button, and confirm. Wiping is a very fast process. This drive will be wiped in under nine minutes. With just this one session, TaskForce runs at 2TB/hour.
View SMART And Unclip HPA/DCO
In the other section of the Task menu you will find two features: ‘View SMART’ and ‘Unclip HPA/DCO.’ The first one is ‘View SMART.’ Select this feature and then the drive, the status of which you would like to look up. Click the ‘Start’ button, and immediately you see the table with a number of attributes. These are the statistics that the drive is keeping track of to provide the users with information that can predict the health of the drive.
Not all of the parameters are equally critical: the most important ones are ‘Reallocated Sectors Count,’ ‘Current Pending Sector Count,’ and ‘Uncorrectable Sector Count.’ This drive has two of these parameters in Fail status, which means that the drive is in critically bad condition.
The second feature here is ‘Unclip HPA/DCO.’ Click the function and it will open the device selection panel. You can see a notification in this port about the HPA restriction enabled in the drive. If you try to image the drive, you will also notice the same notification, and all across the TaskForce interface, this device will be listed with this notification. By clicking on it in the ‘Devices’ panel, you open the latest diagnostics report, which says that the device has a 3TB capacity.
Run the diagnostics again, and look up the Firmware part of the report for more details. The diagnostics report shows that there is HPA enabled on the device. Now go to ‘Other’, click ‘Unclip HPA/DCO’, and click the ‘Unclip’ button. Within a second or two, you have the restriction removed, and now you can proceed with imaging. The native max address has been restored to the original value and the original 4TB capacity. All sectors of the drive are now accessible.
In the home screen, then click ‘HPA Report’ is now listed. When you try to image or hash the drive, the actual 4TB capacity will now be displayed. You can now proceed with imaging the drive.
Remove Source Drive HPA Temporarily Until Power Cycle
In TaskForce there is one more way to handle the drives listed with HPA. Click ‘Image’ and select the source that is listed with HPA and appears to have 500GB of capacity. Click ‘Start new’ button and select the target drive.
In the pop-up window, a notification suggests that you unclip the HPA until the next power cycle. Click ‘Yes.’
Now you can already see that the capacity in fact appears to be 1TB. The log recorded at the beginning of this imaging session that HPA was unclipped. Now the whole area of the drive can be imaged, but the next time the drive is powered, the HPA will be activated again. This technique allows you to get access to the data of the drive while avoiding changing its status.
TaskForce Settings
Let’s have a look at the Service menu. Click the Menu button in the top right-hand corner of the screen. In the ‘General settings’ category you can select the language of the interface and switch between English, Chinese and Japanese.
The ‘Work folder’ option defines where the case management system will be stored. It is by default stored on the NVMe drive that is installed inside the unit, but you can also switch to the external storage and store the database on your server.
When you switch to a remote folder, you are starting a new database in the new location. If you switch back to the internal storage, you will have access to the old database again.
‘Device ready timeout’ sets the waiting time for a drive to become ready after it has been powered. Upon completion of this timeout, TaskForce will stop waiting for the device to become ready.
The two subsequent options are for powering off of the devices upon completing tasks, and when they have been idle for a while. Both options are meant to decrease power consumption by the unit, and a more careful treatment of the connected drives.
In the Network section of the Settings menu, there is [a] Wifi hotspot option. If you enable the hotspot, TaskForce can be accessed from the other Wifi-enabled devices by entering the IP address indicated here in their Google Chrome browsers. By default, the hotspot is disabled. To connect to the network, you need to know the SSID and the password, which you can adjust the way you like. If you tick ‘Hidden mode’ checkbox, the network will be invisible.
There are two 10GB Ethernet ports in TaskForce. Once one of them is connected to the local network, you can see the network details here. The second Ethernet cable is not plugged.
Enabling Jumbo frames helps speed up the data transfer rate. You also would need to activate Jumbo frames in the settings of the server’s network adapter as well as in the settings of the network switch, should it be necessary.
‘Store shared folder logins and passwords in TaskForce’ can be enabled to avoid entering logins and passwords to shared folders every time. These credentials will be stored as encrypted data.
To restore the default settings, click the ‘Reset’ button at the bottom of the page.
How To Update TaskForce Firmware
Open the Service menu and click ‘Release notes’ category to view new and updated features of the most recent TaskForce firmware release, so that you can take advantage of the latest additions to the tool. The release notes explain the major features of this release, and in the change log below you can see the full list, as well as the bug fixes.
Click ‘Update firmware’ category in the Service menu, and you get the instructions [for] how to update to the latest version. In the atola.com website, click the Download button to get the latest firmware version. You can also see here a link to the change log, and a link to the page where you can suscribe to get notifications about the releases.
There are two ways of updating. The first one, from Downloads folder, is for when the unit is connected to the network. The second one, with USB stick, allows upgrading the firmware without getting the unit connected to the network in standalone mode. Simply plug an exFAT USB stick, with a firmware version, to one of the USB ports of the unit.
Let’s select our firmware file from the Downloads folder now, where we have an upcoming release firmware. Click the ‘Update’ button and wait a few moments for the update to be installed.
In the Home screen, a report about ‘Firmware update’ has been created. When you open the Service menu now, you can see a new category called ‘Express Mode’, that has only been added in this firmware version. By clicking the ‘Activation status’ of the Service menu, you can check the status and expiry date of your subscription.
To update the subscription, you need to get an activation code. It will be sent to you upon the purchase of your subscription. To buy the subscription, go to atola.com website and in ‘Ordering’ section of the menu, click ‘Extend Subscription’ subcategory, and proceed with the purchase, or contact our Sales department.
It is important to mention that subscription covers your unit with lifetime warranty, as well as three firmware updates per year, and support of our team of engineers who designed, and continue developing, the system.
Regularly Updated TaskForce Manual
The Task panel, the top panel, the Service menu, and the whole interface, are regularly updated as we release new features and improve the user interface.
In the About page you see the current firmware version. Any updates are reflected in the Product menu. You can find it at atola.com in the Guides section of the Product menu. The menu is regularly updated. Some of the articles will help you to figure out the best way to configure your network. Others will explain how to work with the system and image from different types of drives, or to a specific destination, like a password-protected server.
You can learn how to use the automation capabilities TaskForce provides via Web API, which is already being used in many organisations; or you will learn how to use all the multitasking capabilities TaskForce has to offer.
It is possible to generate a single page menu. It will include all the articles, and you can save it as an HTML file, a PDF file, or have it printed out.
Thanks for your attention!
May the TaskForce be with you 🙂